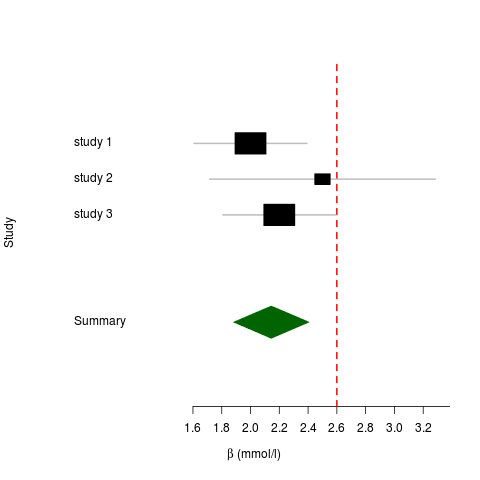
This is a quick example of how to do a fixed meta-analysis using the R package Rmeta, just so I dont have to look it up again next time:
## Create data frame containing betas and standard errors df <- data.frame() df <- rbind(df, c(2., 0.2)) df <- rbind(df, c(2.5, 0.4)) df <- rbind(df, c(2.2, 0.2)) ## Add study names df <- cbind(df, c("study 1", "study 2", "study 3")) colnames(df) <- c("beta", "se_beta", "name") ## Do the meta-analysis ms <- meta.summaries(df$beta, df$se_beta, names=df$name) ## Add some colors mc <- meta.colors(summary="darkgreen", zero="red") ## Make a forest plot plot(ms, xlab=expression(beta ~ " (mmol/l)"), ylab="Study", colors=mc, zero=2.6) |
The resulting plot looks like this:

Leave a Reply